
Figure 2.
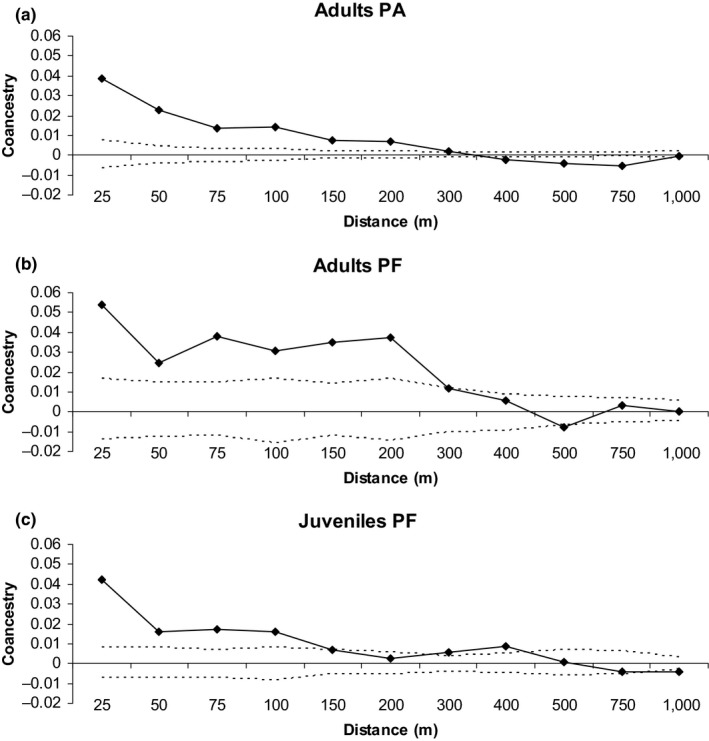
Spatial genetic structure in the adults of PA (a) and PF (b) and the juveniles of PF (c). The continuous line represents the average estimated coancestry coefficient described in Loiselle et al. (1995), and the dashed lines represent the confidence interval at the 95% probability of the hypothesis of no spatial genetic structure (H0: θ xy = 0)