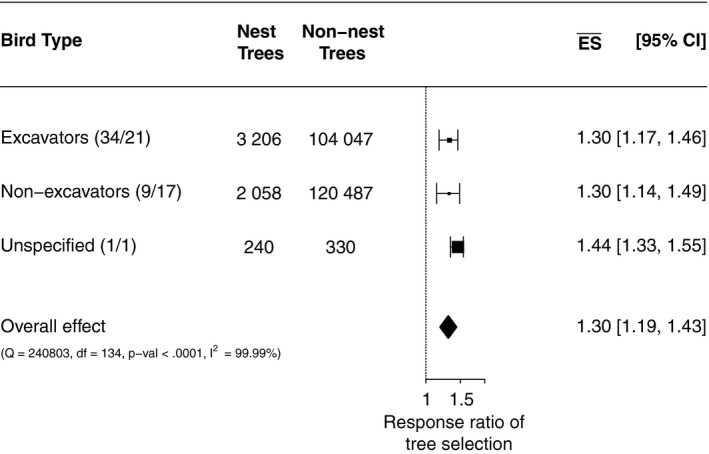
Figure 2.

Forest plot showing subgroups and the overall effect of all subgroups combined on log‐scaled x‐axis. The vertical line is the line of no effect. The response ratio of tree selection is >1, which indicates that large‐diameter trees were selected for nesting by cavity‐nesting birds. Numbers in parenthesis refer to number of studies/bird species contributing to this category. Unspecified bird species are counted as one single species because only one overall effect size could be estimated for these species
