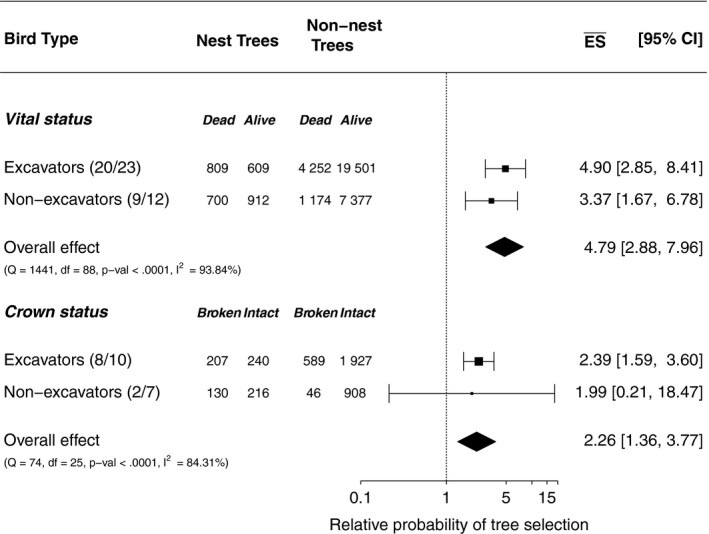
Figure 3.

Forest plot showing subgroups for vital status and crown status and the overall effect of all subgroups combined on log‐scaled x‐axis. The relative probabilities of tree selection are >1 which indicates that the proportion of trees that were dead or had a broken crown was higher for nest than available trees. Numbers in parenthesis refer to number of studies/bird species contributing to this category
