
Figure 5.
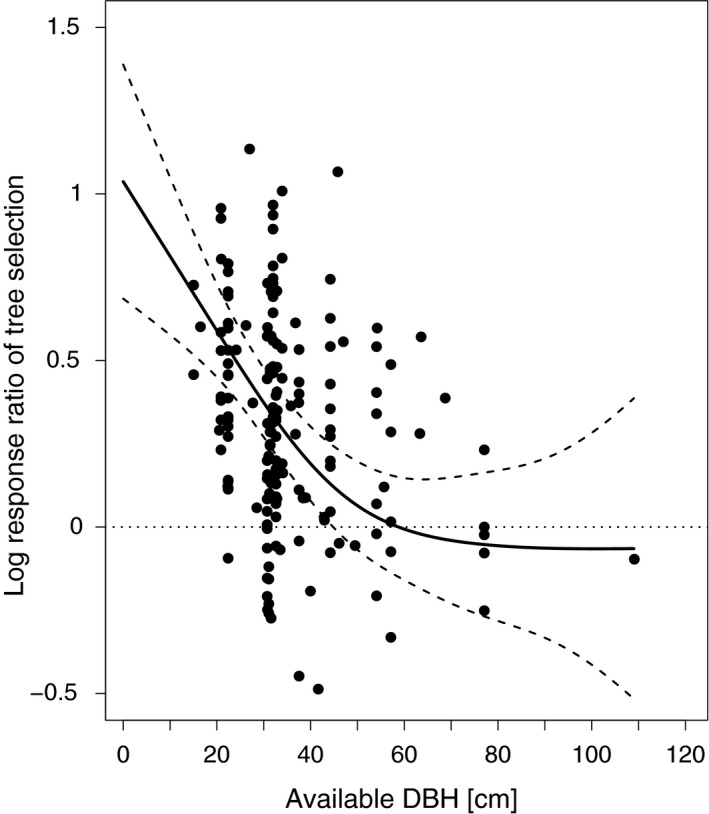
Selection for nest site (log of the response ratio used in Figure 2) as a function of available DBH. The curve (solid line, dashed lines indicate 95% confidence intervals) was predicted from a generalized additive mixed model with two random effects for bird species and study (N = 176). A value of 0 indicates no difference between the selected and the available DBH. Values >0 indicate that the mean available DBH was selected against