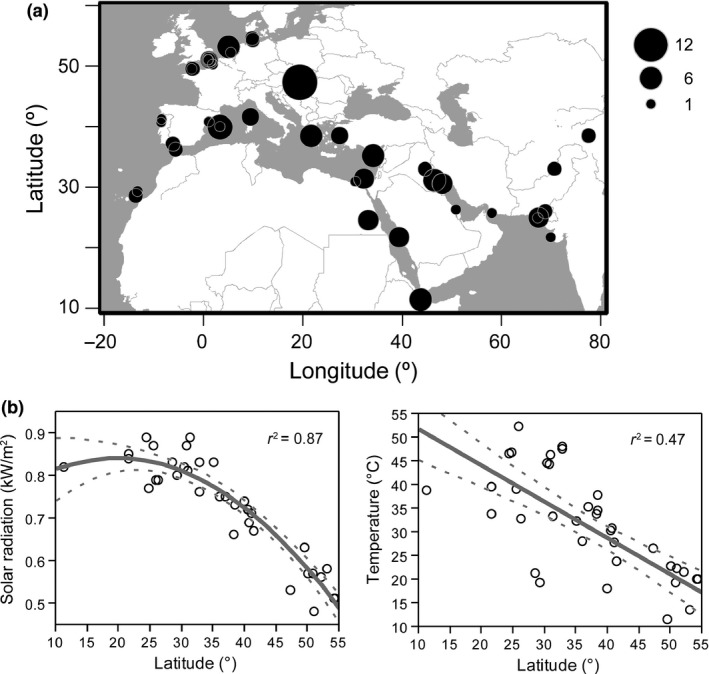
Figure 2.

(a) Map showing the spatial distribution of collection sites for eggs of Kentish plover. Symbol size is proportional to sample size. (b) Relationships between latitude and both solar radiation and temperature in the localities where the eggs were collected
