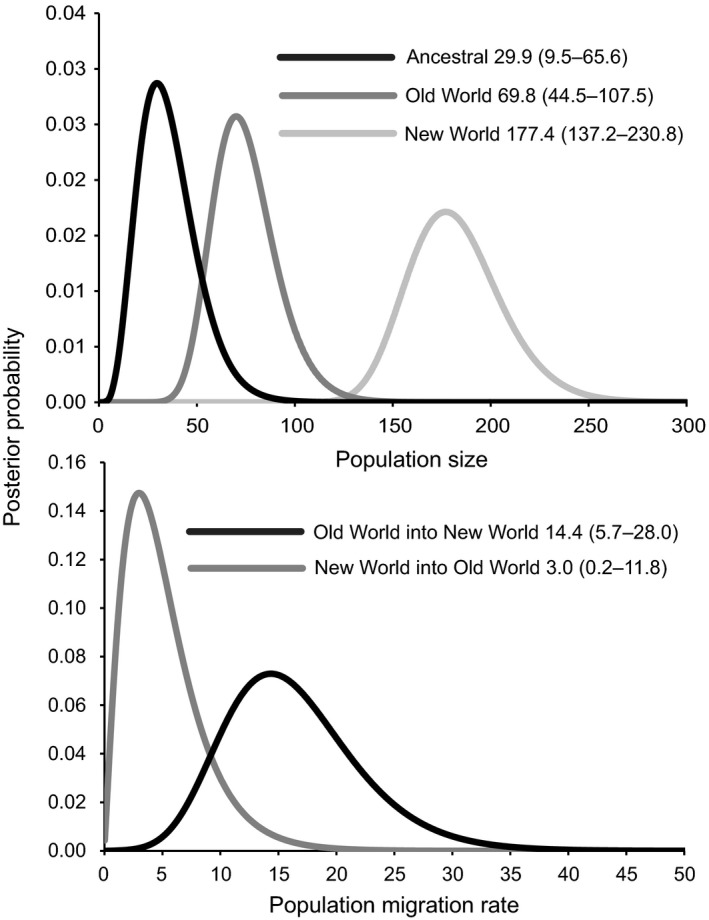
Figure 6.

Estimates of the population size (Ɵ; top) and number of migrants per generation (population migration rate; bottom) for Old World (Eurasia) and New World (North America) greater white‐fronted goose populations with lower and upper bound of the estimated 95% higher posterior interval (HPD) indicated. Please see Figure 2 and Table 1 for populations included in each of these two groups. In general, samples included in the Old World include population codes Q–W and New World includes population codes A–N
