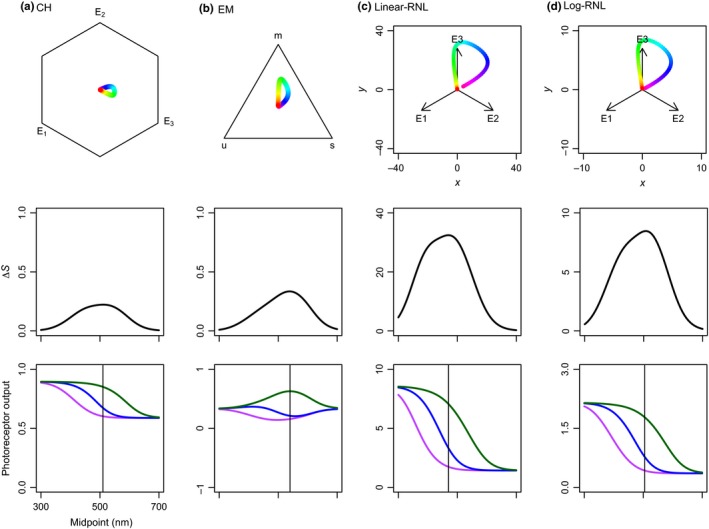
Figure 1.

Chromaticity diagrams, ΔS, and photoreceptor outputs of the basic setup of color vision model simulations: (a) Chittka (1992) color hexagon (CH), (b) Endler and Mielke (2005) color triangle (EM), and (c) linear and (d) log‐linear Receptor Noise Limited models (Linear‐RNL and Log‐RNL; Vorobyev & Osorio, 1998; Vorobyev et al., 1998). Colors in chromaticity diagrams correspond to reflectance spectra from Supporting Information Figure S1d. ΔS‐values (middle row) and photoreceptor outputs (bottom row) as a function of reflectance spectra with midpoints from 300 to 700 nm. Violet, blue, and green colors represent short, middle, and long λ max photoreceptor types, respectively. Vertical lines represent the midpoint of maximum ΔS‐values
