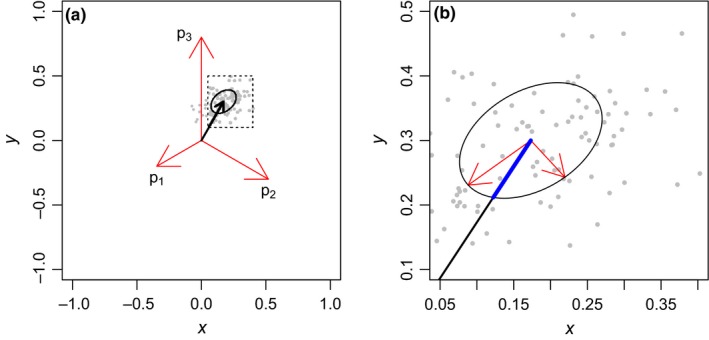
Figure 4.

(a) Example of photoreceptor outputs (p) from a trichromatic animal projected as vectors (red arrows) into a chromaticity diagram. The black arrow denotes a vector () resulting from adding vectors , , and . (Equation 6). Its components are the coordinates in the color space and its length, the ΔS value to the background in Chittka (1992) and Endler and Mielke (2005) models. Receptor noise models assume that discriminability thresholds are defined by noise at the photoreceptors. Gray points denote randomly generated vectors from normally distributed p values and their receptor noise (one standard deviation). Ellipse denotes the standard deviation. The ellipse is calculated from vectors and their receptor noise. (b) Inset showing the ellipse and its eigenvectors, with the size adjusted to one standard deviation. The length of the line segment in blue represents vector standard deviation. Receptor noise value against the background is simply the length of vector divided by its standard deviation
