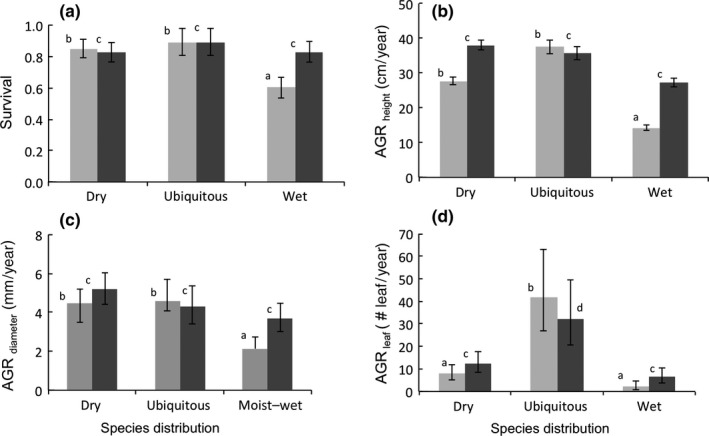
Figure 4.

Absolute growth rate and survival of species with different distributions (dry forest species, ubiquitous species, and wet forest species) in dry (gray bars) and wet (black bars) tropical forests at the end of 2‐year period. (a) Survival, (b) height growth, (c) diameter growth, and (d) number of leaves. Mean and standard errors are shown. Bars accompanied by different letters are significantly different at p ˂ 0.05 (least significant difference post hoc test). The different letters represent significance within each forest site
