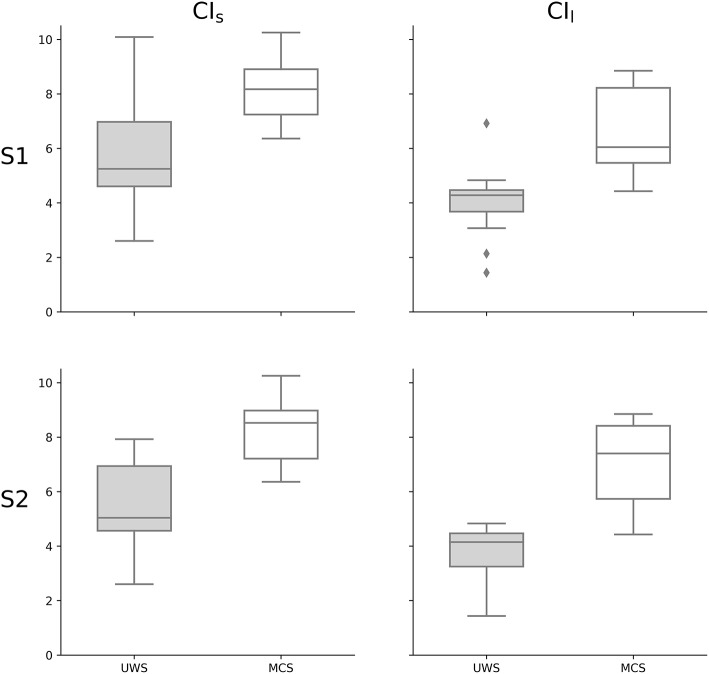
Figure 3.
Complexity Index statistical analysis comparing UWS and MCS patients summarized as a box plot. Higher values of CIs (z = −3.346, p < 0.001) and of CIl (z = −4.095, p < 0.0001) were observed for MCS group compared to UWS using Mann–Whitney's test. The 1st row compares the entire group of patients S1 (n = 30), while the 2nd row compares the subgroup of patients S2 (n = 21) who underwent fMRI analysis. The 1st column represents the complexity index (CI) in short time scale, while the 2nd column is for the long time scale. White boxes represent MCS patients; gray boxes the UWS patients. The boxes range from Q1 to Q3, while the whiskers are defined at the 1.5 interquartile range, and the black lines are the medians, points are outliers.

