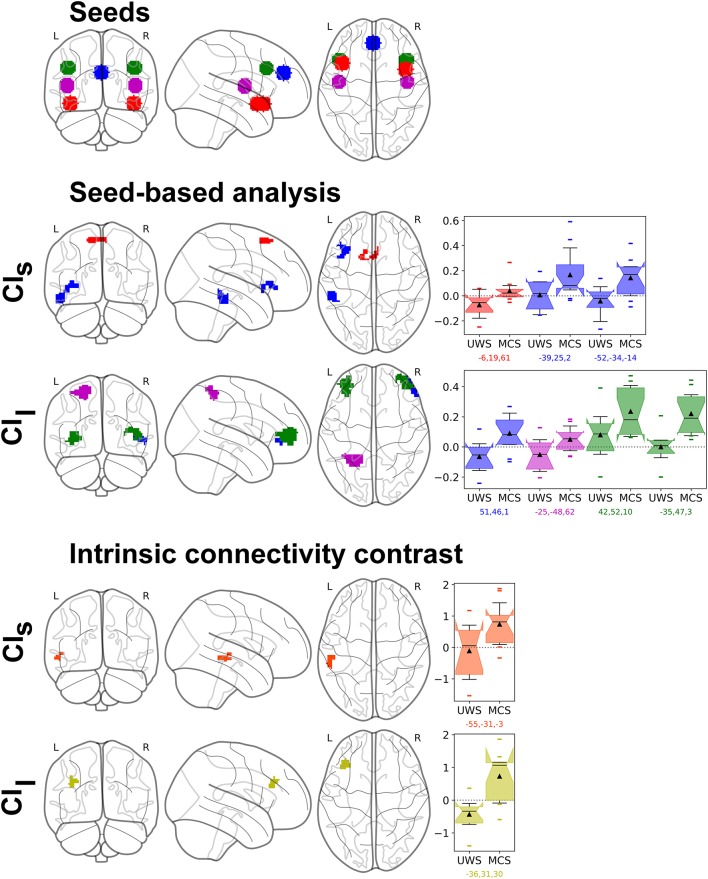
Figure 6.
Resting-state fMRI analysis results of the parametric regression between CI and UWS/MCS patients' connectivity changes in the S2 group (n = 21). Top row shows the seeds: Fronto-Insular (FI, red), Paracingulate cortex (PC, blue), Superior Temporal Gyrus (STG, magenta), Dorso-lateral prefrontal cortex (DLPFC, green). Middle rows show the seed-based analysis results, with same colors as the seeds, and effect size as box plots (range Q1-Q3, whiskers interquartile 1.5, black line as median, black triangle as mean, points as outliers), first with the CI in short time scale (CIs) and then long time scale (CIl). We can see a positive correlation of the CIs with the connectivity between FI with Superior Frontal Gyrus (red) and between PC with two clusters covering the Temporal Gyrus (inferior and middle), the Frontal Operculum and the Insular Cortex (blue). The CIl is positively correlated with the connectivity between PC and the right Frontal Pole (blue), between STG with the Superior Parietal Lobule (magenta) and between DLPFC and the left and right Frontal Poles (green). Bottom rows show the hypothesis-free intrinsic connectivity correlation (ICC) results, with a positive correlation between values of CIs and an increase of intrinsic connectivity of the posterior Middle Temporal Gyrus (pMTG) and posterior STG (orange); and a correlation between CIl and an increase of intrinsic connectivity in the Middle Frontal Gyrus (MFG) (yellow). Statistical significance was considered at permutation of residuals test cluster-mass p-FWE < 0.1 and primary threshold p-uncorrected < 0.001.

