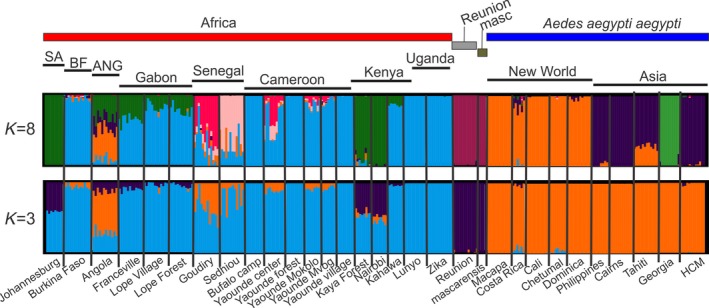
Figure 2.

STRUCTURE bar plots for all Ae. aegypti populations and Ae. mascarensis. Population names are reported on the x‐axis. The y‐axis reports the probability of each individual (Q‐value) assigned to one of the genetic groups identified by fastSTRUCTURE, which are represented by different colors. Each bar represents an individual. Individuals with 100% assignment to one group are identified by a single color. Individuals with mixed ancestry are represented by bars with different percentages of colors. The thick black lines within the plots indicate population limits. Abbreviations: SA: South Africa, BF: Burkina Faso, ANG: Angola, masc: Ae. mascarensis
