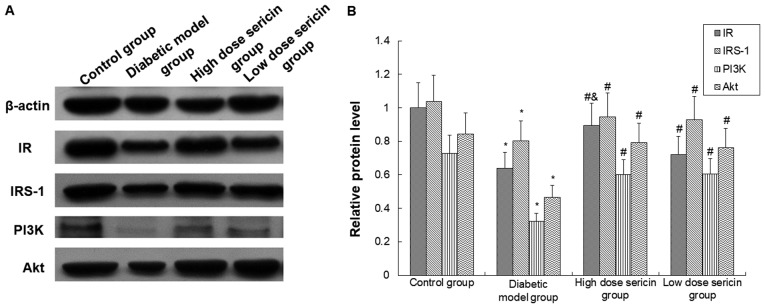
Figure 4.
Analysis of IR, IRS-1, PI3K and AKT protein expression levels by western blotting. (A) Expression of IR, IRS-1, PI3K and AKT proteins in the rat livers of each group was detected by western blot analysis. (B) Quantification of protein expression in each group. *P<0.05 vs. control group; #P<0.05 vs. diabetic model group; &P<0.05 vs. low-dose sericin group. IR, insulin receptor; IRS-1, IR substrate-1; PI3K, phosphoinositide 3-kinase; AKT, protein kinase B.

