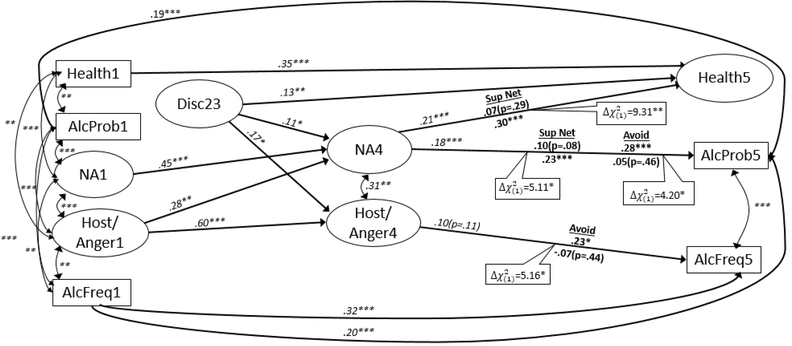
Figure 2.
Structural Equation Model of the Discrimination on Health Problems, Alcohol Frequency, and Alcohol Problems.
Note. Estimated path coefficients are completely standardized. Numbers in construct names indicate wave of measurement;
Disc = perceived racial discrimination; NA = anxiety and depression; Host/Anger = hostility/Anger
Heath = health problems; AlcFreq = alcohol frequency; AlcProb = alcohol problems
Bold coefficients are stacked on moderators (Sup Net = support networks, Avoid = Avoidant Coping), Above the line = High values/Below the line = Low Values
*p≤.05; **p.<.01; ***p<.0001.

