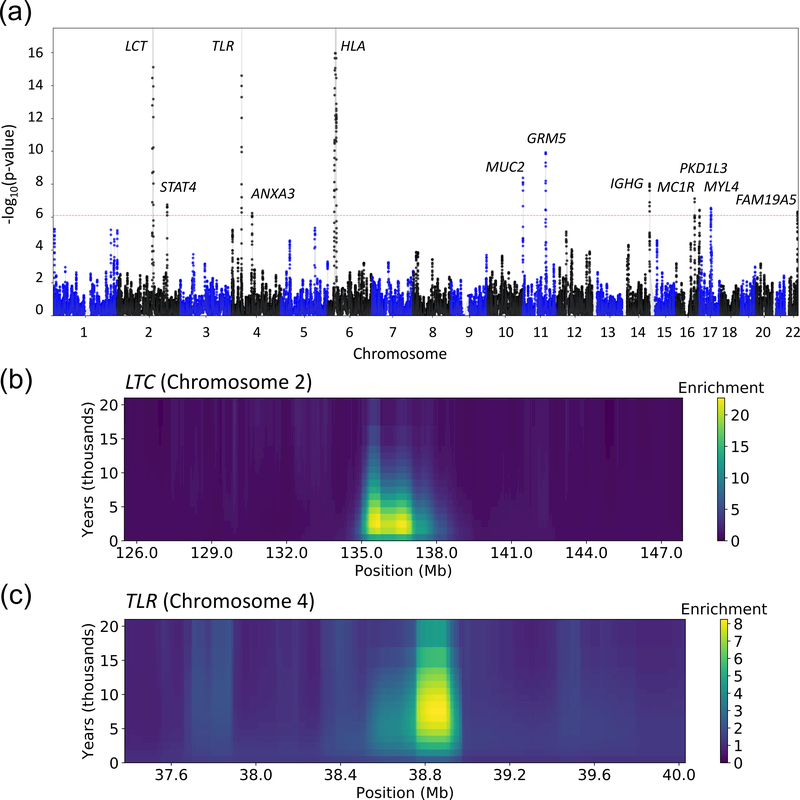
Figure 3. Genome-wide scan for recent positive selection in the UK Biobank data set.
(a) Manhattan plot with candidate gene labels for 12 loci detected at genome-wide significance (adjusting for multiple testing, p < 0.05 / 63,103 = 7.9 × 10⁻⁷; dashed red line). The DRC150 statistic of recent positive selection was computed using all individuals of British ancestry from the UK Biobank (n=113,851, divided in batches of ~10,000 samples; see Online Methods for details on how p-values were computed). Numerical results for top loci are reported in Table 1; additional suggestive loci are reported in Supplementary Table 6. (b) Enrichment for recent coalescence events at the LCT locus (Chromosome 2). (c) Enrichment for recent coalescence events at the TLR locus (Chromosome 4). y-axis labels assume a 30-year generation time. Analogous plots for other top loci are provided in Supplementary Figure 7.

