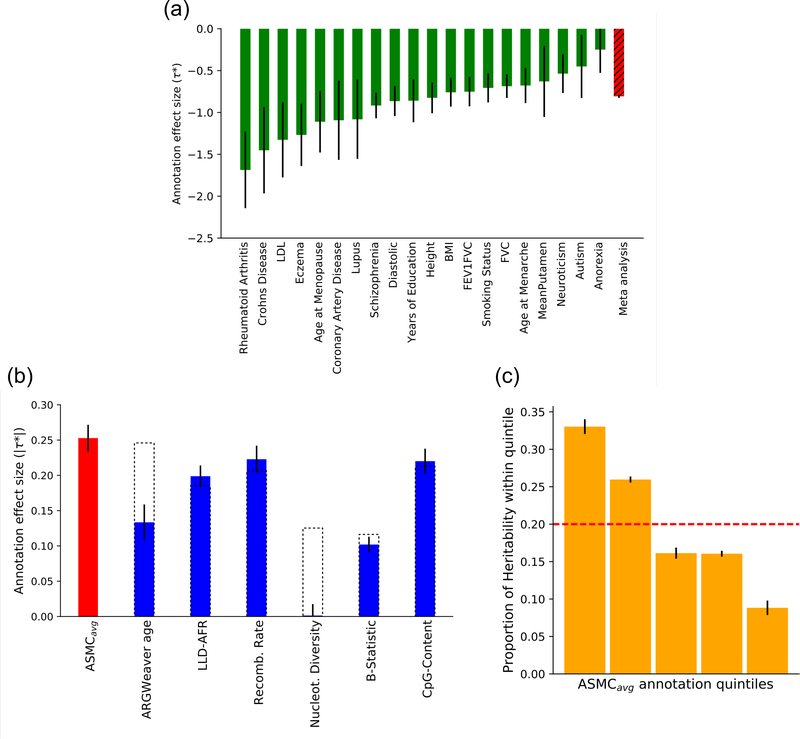
Figure 4. S-LDSC analysis of ASMCavg background selection annotation and disease heritability.
(a) τ* value of the ASMCavg annotation for 20 independent diseases and complex traits (sample sizes in Supplementary Table 8). Error bars represent SE of the τ* estimate. (b) Absolute values of τ* estimates (meta-analyzed across 20 independent diseases and complex traits, sample sizes in Supplementary Table 8) in joint analysis conditioned on baselineLD annotations. Error bars represent SE of the meta-analyzed τ* estimate. Dashed bars reflect values for six baselineLD annotations linked to background selection before the introduction of the ASMCavg annotation. (c) Proportion of heritability explained by SNPs within different quintiles of ASMCavg annotation (in joint analysis conditioned on baselineLD annotations). Error bars represent SE of the estimated proportions. Numerical results are reported in Supplementary Table 13.

