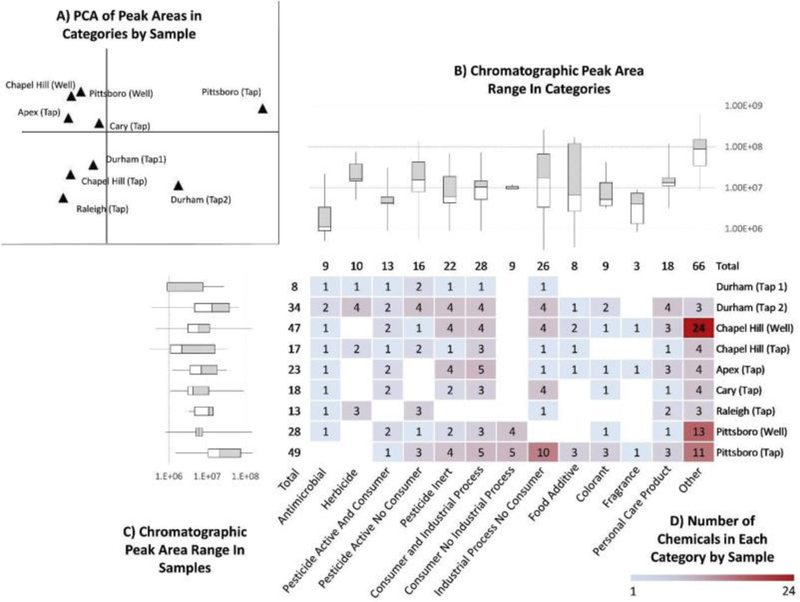
Fig. 4.

A) First (x-axis) and second (y-axis) principal components in a principal component analysis using summed peak areas for all compounds within a category; B) box and whisker plots representing the range of peak areas for compounds within a category; C) box and whisker plots representing the range of peak areas for compounds within each sample; and D) heat map showing the number of compounds that fall into each category by sample. Blank squares indicate no A1α compound was present for a category in a sample.
