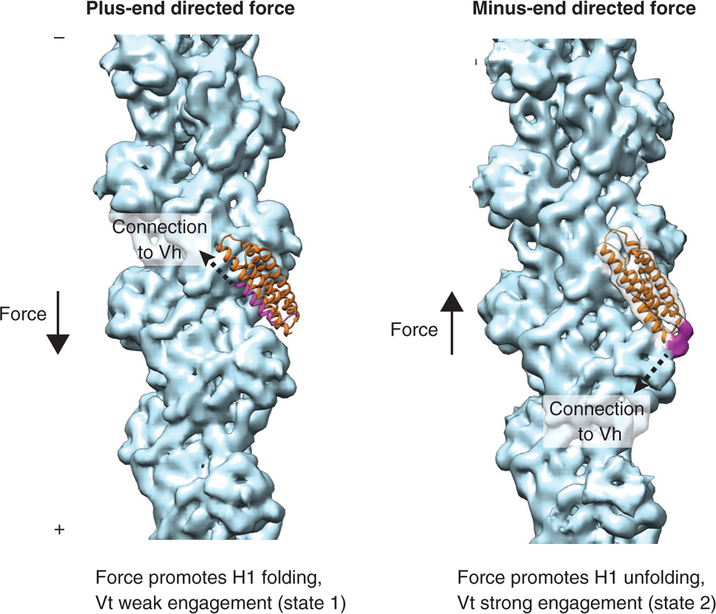
Figure 1. Speculative mechanistic model of the two-state vinculin-actin catch bond.
Solid arrows represent force vectors, dotted arrows represent the approximate orientation of the connection between vinculin head (Vh) and vinculin tail (Vt) domains. Left: state 1, the weak binding state. Residues 896–1047 of the crystal structure of Vt in the absence of actin (PDB 1QKR) are displayed in ribbon representation, superimposed on the cryo-EM structure of the Vt-actin complex (not shown). H1 is magenta; H2–H4 are orange. A cryo-EM reconstruction of naked F-actin (EMD 6448) is displayed in light blue. Right: state 2, the strong binding state. Vt from the cryo-EM structure of the Vt-F-actin complex (PDB 3JBI) is displayed in orange ribbon representation. The cryo-EM density map of the complex (EMD 6446) is displayed with the following coloring: Vt helices 1–4, transparent grey; actin, light blue; density corresponding to unfolded H1, magenta.

