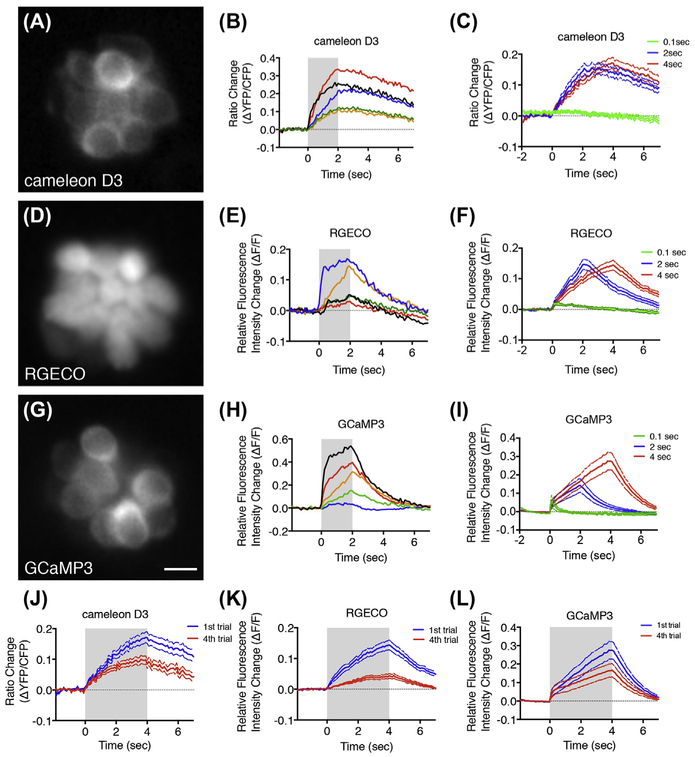
FIGURE 1. Comparison of cameleon D3, RGECO, and GCaMP3 calcium signals in zebrafish hair cells.
(A, D, G) Widefield images of neuromasts expressing cameleon D3, RGECO, and GCaMP3, respectively. (B, E, H) Traces of five representative, individual hair cells for each indicator. (C, F, I) Average calcium response for each indicator in response to a 0.1, 2, and 4 s stimulus, n = 10–15 hair cells. (J, K, L) Calcium signals in response to a 4-s stimulus using each indicator after the first and fourth trial. Larvae were imaged at day 4. Gray boxes denote stimulus period. Scale bar = 5 μm. (See color plate)

