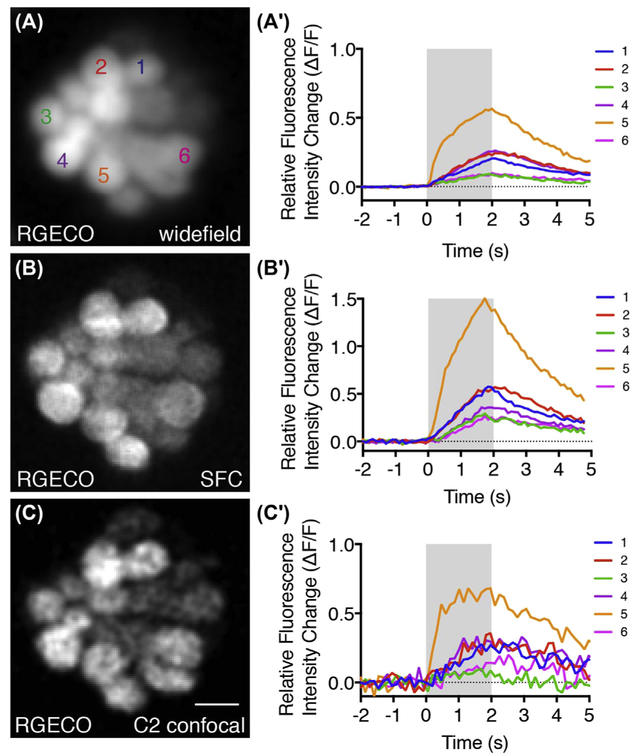
FIGURE 4. Comparison of hair-cell evoked calcium responses on three imaging systems.
(A, B, C) Tg[myo6b:RGECO] images from the same neuromast acquired on a Nikon widefield microscope, Bruker SFC confocal microscope, and Nikon C2 confocal microscope, respectively. (A′, B′, C′) Evoked calcium responses in response to a 2-s step deflection measured on each system using the parameters outlined in Table 1. Larvae were examined at day 5, scale bar = 5 μm. (See color plate)

