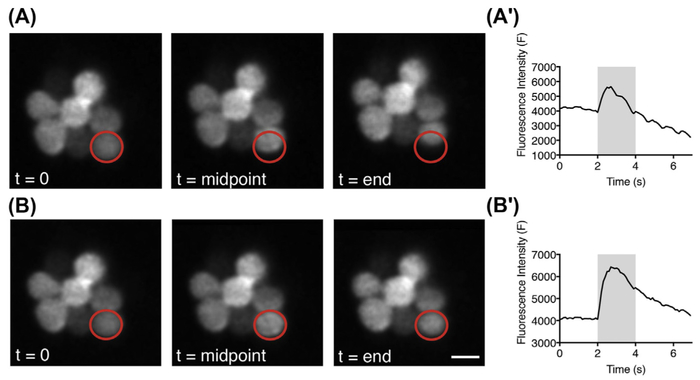
FIGURE 5. Live imaging of neuromast RGECO calcium signals with and without image registration.
(A) Representative images captured at the onset, midpoint, and end of image acquisition period before image registration. (A′) Temporal curve of the fluorescence intensity before image registration. (B) Representative images captured at the onset, midpoint, and end of image acquisition period after ImageJ StackReg image registration. (B′) Temporal curve of the fluorescence intensity after StackReg image registration. Red circles (gray in print versions) indicate the same ROI used for calculating the fluorescence intensity. Gray bars in (A′) and (B′) indicate the 2-s fluid jet stimulus. Scale bar = 5 μm.

