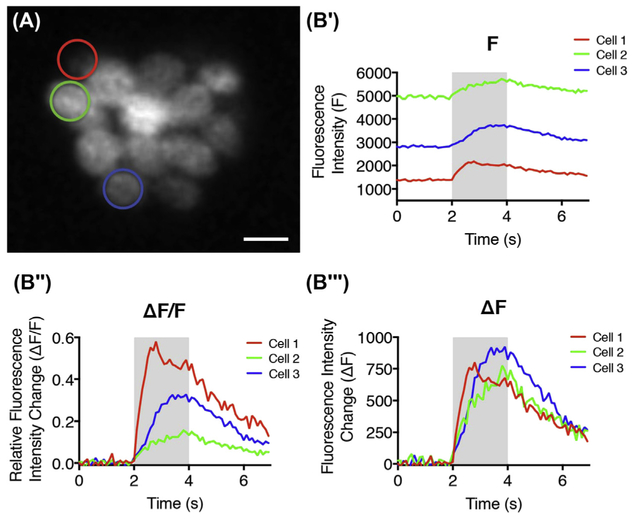
FIGURE 7. Temporal representation of RGECO calcium signal at three selected ROIs.
(A) A representative RGECO neuromast image with three ROIs (hair cells) indicated by red, green, and blue circles respectively. (B′) Temporal curve of the fluorescence intensity. (B″)Temporal curve of the relative fluorescence intensity change. (B‴) Temporal curve of the fluorescence intensity change. Scale bar = 5 μm. (See color plate)

