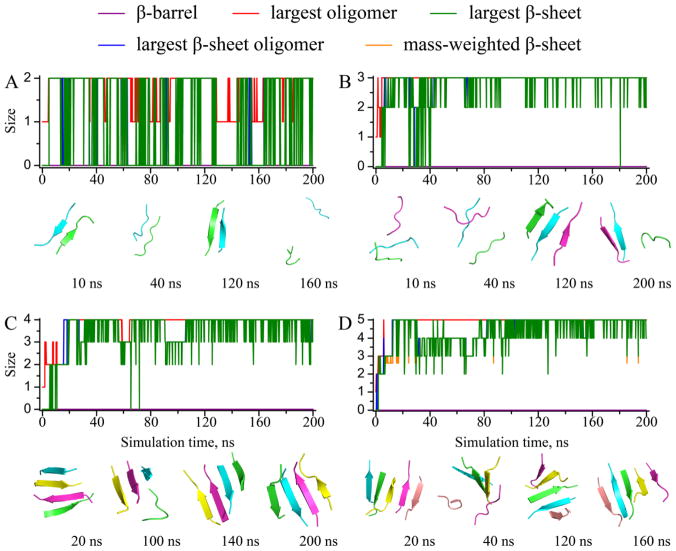
Figure 4.
The dynamics of oligomerization and aggregation. Sizes of the largest oligomer, the largest β-sheet oligomer, the largest β-sheet, the mass-weighted β-sheet, and the β-barrels were plotted as functions of the simulation time for typical simulations trajectories with (A) 2, (B) 3, (C) 4, and (D) 5 peptides. Snapshot structures at different times with peptides shown as cartoon with different colors were used to illustrate the aggregate structures and their conformational dynamics.

