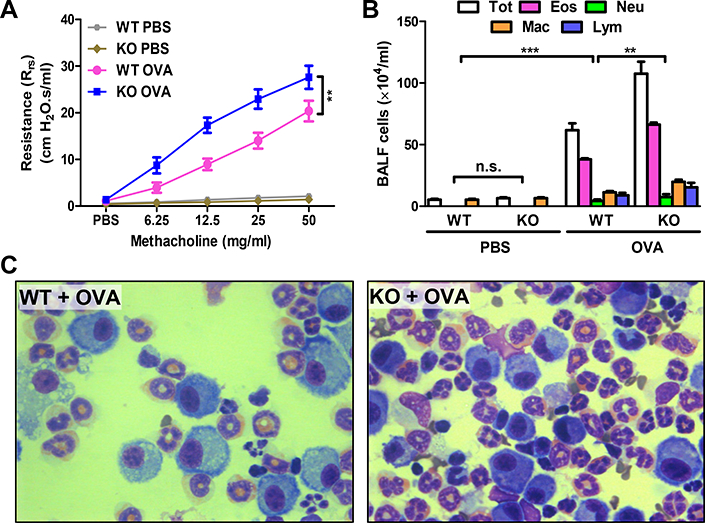
FIGURE 1. AEC-PPARγ knockout aggravates AAD-induced airway hyperresponsiveness to methacholine and inflammatory cell infiltration.

AAD was induced in WT and AEC-PPARγ−/− mice by OVA sensitization on days 0 and 7 and challenge on even-numbered days 14–22. Control mice were similarly treated with PBS. Twenty-four hours later, total respiratory resistance to increasing concentrations of inhaled methacholine was determined. BALF and lung samples were also obtained. (A) Total respiratory resistance. (B) Total (Tot) and differential (Eos = eosinophils; Neu = neutrophils; Mac = macrophages; and Lym = lymphocytes) cell count in BALF. (C) Photomicrographs (100×) of Diff-Quik-stained cells in BALF from the indicated treatment groups. The data are expressed as the mean ± SD with n = 6 mice/group. The results were reproduced at least two times independently; **P < 0.01, ***P < 0.001, n.s. = non-significant.
