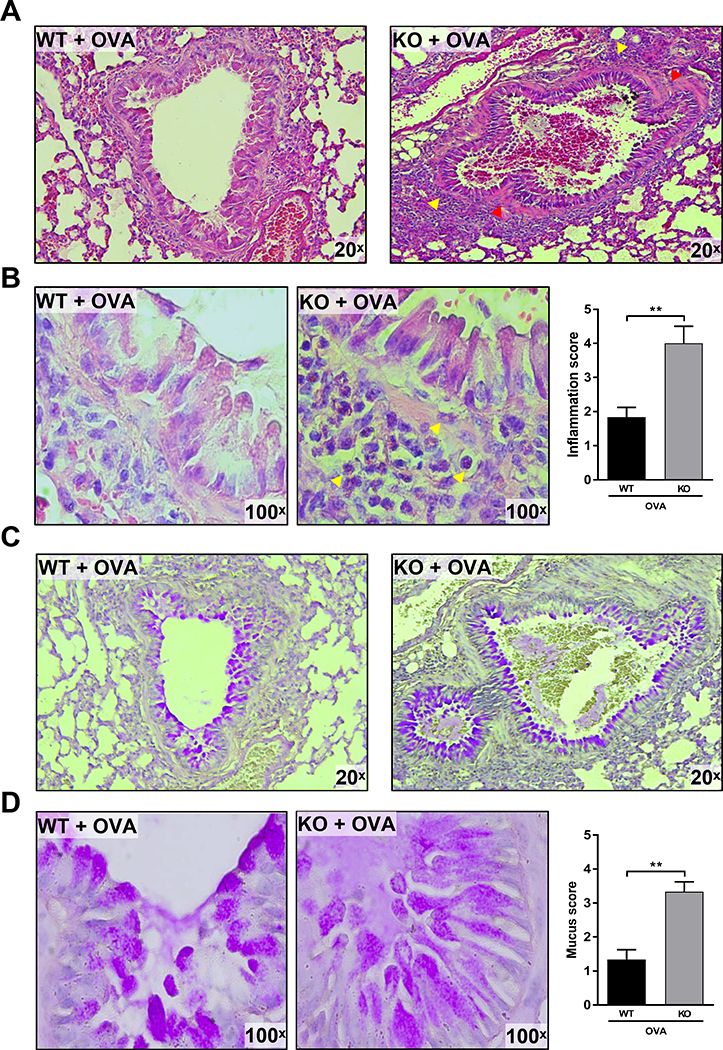
FIGURE 2. AEC-PPARγ knockout aggravates AAD-induced inflammatory cell infiltration, airway remodeling, and mucus production.

AAD was induced in WT and AEC-PPARγ−/− mice by OVA sensitization on days 0 and 7 and challenge on even-numbered days 14–22. Control mice were similarly treated with PBS. Twenty-four hours later, lung sections from the indicated treatment groups were prepared and examined histologically. (A) H&E staining showing inflammation with infiltrating leukocytes. Red arrowheads indicate epithelial cell hyperplasia and subepithelial fibrosis. (B) 100× images of the same H&E-stained slides showing the infiltrating eosinophils more clearly. Yellow arrowheads indicate leukocytes infiltrating across the airways. Leukocyte infiltration was quantified and presented as inflammation score. (C) PAS-stained slides highlighting goblet cell metaplasia (PAS-positive cells). (D) 100× images of the same PAS-stained slides showing mucus plugs and granulated goblet cells. Mucus staining was quantified and presented as mucus score. The results were reproduced at least two times independently; **P < 0.01.
