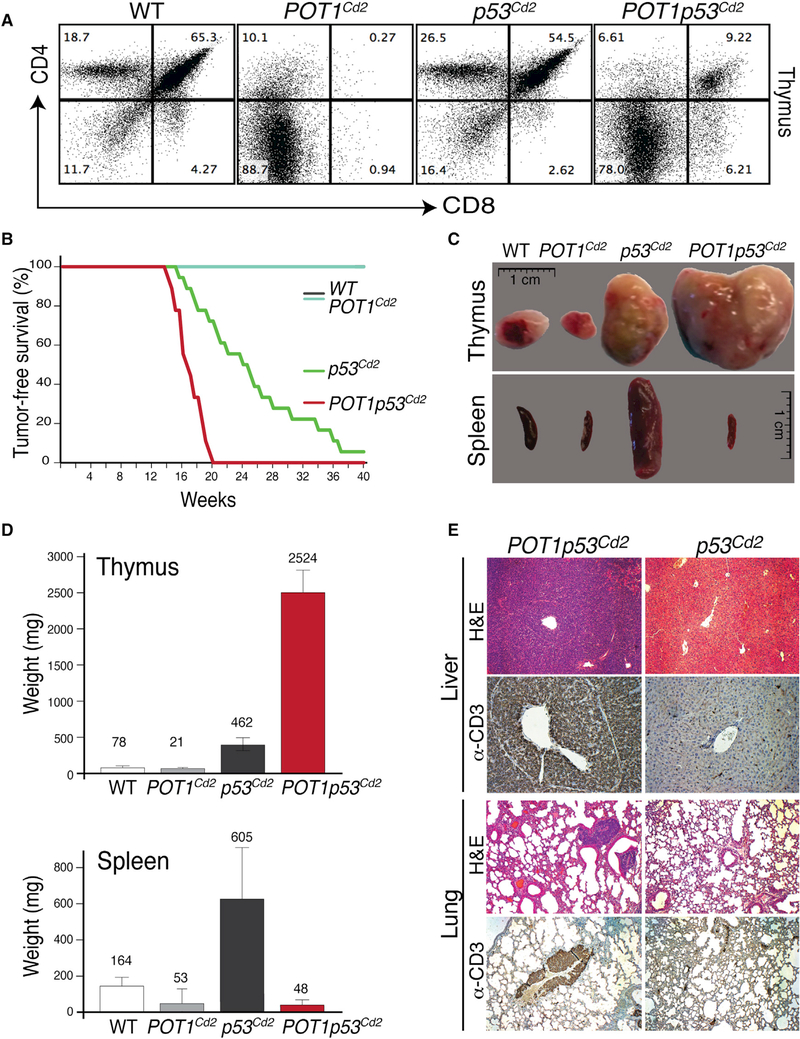
Figure 1. Conditional Deletion of POT1a and p53 in Mouse CLP Cells Leads to Aggressive Thymic Lymphomas.
(A) Flow cytometry analysis of CD4 (y axis) and CD8a (x axis) on thymocytes from mice of the indicated genotypes at approximately 16 weeks of age.
(B) Survival curve of mice of the indicated genotypes: POT1Cd2 (n = 20), p53Cd2 (n = 18), POT1p53Cd2 (n = 18), and Wild-Type (n = 25) (this cohort includes hCd2iCRE negative mice, as well as hCd2-iCRE positive not containing floxed alleles for POT1 or p53); survival curves of p53Cd2 and POT1p53Cd2 mice were compared using the log rank test (p < 0.01).
(C) Representative images of thymus and spleen from mice of the indicated genotypes.
(D)Quantification of thymus (top) and spleen size (bottom) from wild-type (WT), POT1Cd2, p53Cd2, and POT1p53Cd2 mice. The bars represent mean ± SD (n = 10 mice/genotype). The numbers within the graph indicate the mean value.
(E)Histological analysis of liver and lung tissues from p53Cd2 and POT1p53Cd2 mice that succumbed to tumor burden. The tissue sections were stained with H&E, as well as anti-CD3 antibody.

