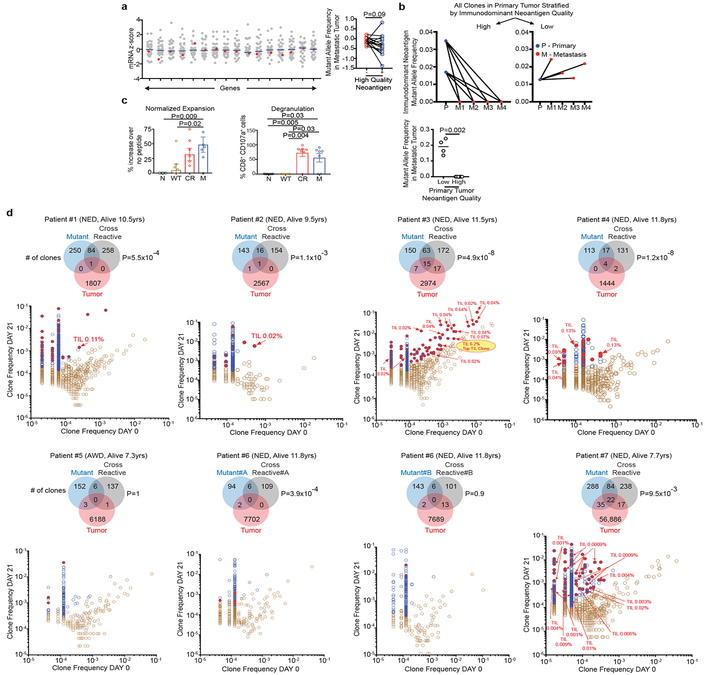
Figure 3: Neoantigen and cross reactive microbial peptide T cells detected in blood and tumors.
(a) Gene expression in the presence (red) or absence (gray) of high quality neoantigenic mutations. X axis = genes, shaded circles = biologically independent samples in individual patients (n=30). Median non-neoantigenic and neoantigenic expression (right). All high quality neoantigenic genes with available mRNA expression are shown. (b) Metastatic propagation of all clones in the primary tumor stratified by neoantigen quality. Mutant allele frequencies in matched primary-metastatic tumors (left) and metastatic tumors alone (right) are shown in biologically independent samples in one patient. (c, d) PBMCs pulsed with no (N), WT control (WT), cross reactive (CR), and high quality neo (M) peptide (n=7). (c) CD8+ T cell expansion and degranulation. (d) Clonal overlap of expanded T cell clones in (c) and archival tumors by TCR Vβ sequencing. Arrows = clones in archival primary tumors with rank frequencies. Venn diagrams show number of T cell clones expanding with mutant, and cross reactive peptides, their respective clonal overlap, and clonal overlap with archival primary tumors. Note presence of clones recognizing both neopeptides and cross reactive peptides in archival tumors. Years surviving following surgery are shown for each individual patient. NED = No Evidence of Disease, AWD = Alive with Disease. Horizontal bars, median values. Error bars, mean ± SEM. n = biologically independent samples in individual patients in a and c. P values were determined in (a) using two-tailed Student’s t test, in (b) using two-tailed Mann Whitney test, in (c) using one-way ANOVA with Tukey’s multiple comparison test, and in (d) as described in the Methods.

