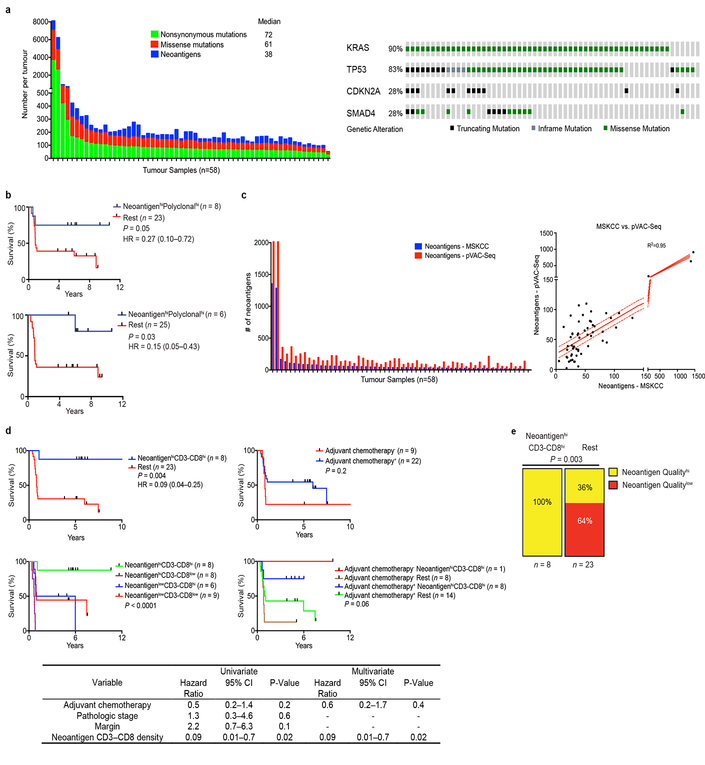
Extended Data Figure 3|. Neoantigen quantity and CD8+ T cell infiltrate identify long term pancreatic cancer survivors.
a, (left) Number of nonsynonymous, missense, and neoantigenic mutations per patient in the MSKCC cohort. Tick marks on the x-axis correspond to individual tumors. (right) Oncoprint demonstrating the frequency of oncogenic driver gene mutations in the MSKCC cohort. b, Overall survival of patients with tumors harboring greater than the median number of neoantigens (NeoantigenHi), and greater than the median intratumoral T cell repertoire polyclonality (PolyclonalHi), compared to all other patients (Rest). Neoantigens were determined using the MSKCC (top) and the pVAC-Seq (bottom) neoantigen prediction pipelines. c. Number of neoantigens per tumor as determined by the MSKCC and pVAC-Seq neoantigen calling pipelines (left). Tick marks on the x-axis correspond to individual tumors. Correlation matrix of neoantigens as determined by the MSKCC and pVAC-Seq neoantigen calling pipelines (right).Solid red line indicates line of best fit, dotted lines indicate 95% confidence intervals. d, Top: Overall survival of patients with tumors harboring greater or lesser than the median number of neoantigens (NeoantigenHi/Low) and CD3-CD8 double positive cells (CD3-CD8Hi/Low), compared to all other patients (Rest) (top left). Patients who did or did not receive adjuvant chemotherapy (adjuvant chemotherapy+/−, respectively) (top right), and all four groups (bottom) are also shown. Table shows univariate and multivariate Cox regression analysis of the associations of clinicopathologic features, adjuvant chemotherapy, and neoantigen-CD3-CD8 number with overall survival. e Distribution of tumors with high and low quality neoantigens in NeoantigenHi CD3-CD8Hi long term pancreatic cancer survivors compared to all other patients (Rest). n = biologically independent samples in individual patients. P-values were determined using log-rank (b, d), and Chi-square (e) tests.

