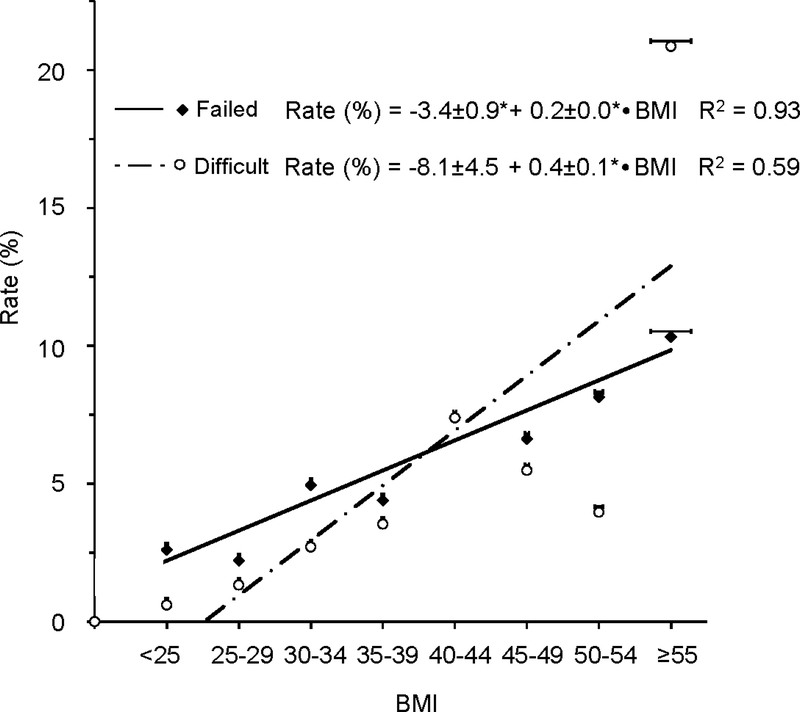
Figure 1:
The rate (in %) of difficulty (white circles, dotted line) and failure (black diamonds, continuous line) of epidural catheter placement as a function of body mass index (BMI, in kg/m2). Regression analysis of binned data in BMI intervals of 5 revealed a significant linear relationship and correlations of BMI vs. difficulty and failure, respectively. All values are given ± standard error. For easier visibility, standard errors are displayed as capped horizontal bars slightly above the mean symbols. * P < 0.05 (two-tailed).

