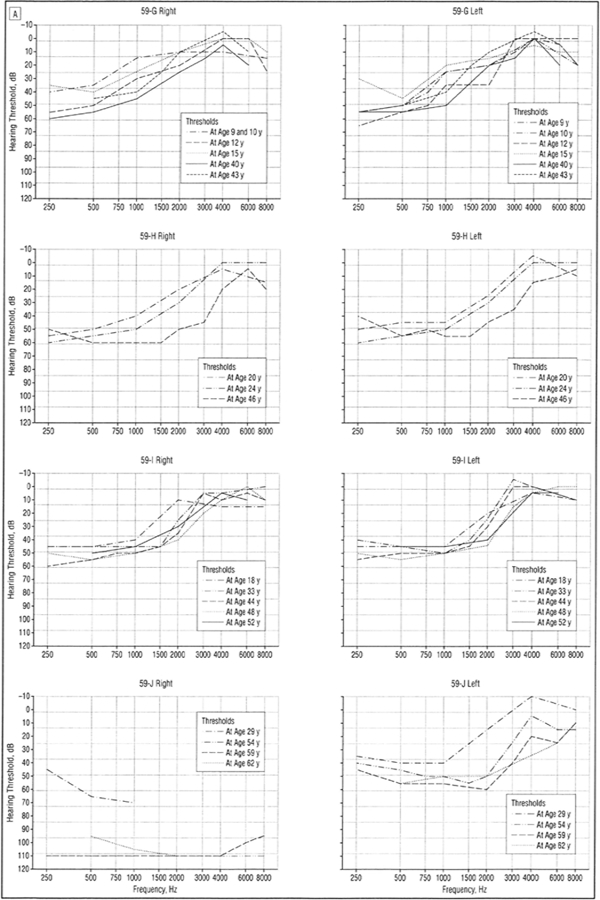
Figure 4.

A, Audiograms (divided into right and left ear) of patients 59-G to 59-J with low-frequency hearing loss from family 59 demonstrating progression of hearing loss over decades. All curves represent air conduction thresholds, with the exception of person 59-J, right ear, curve for age 29 years, which represents bone conduction thresholds (considered vibrotactile).
