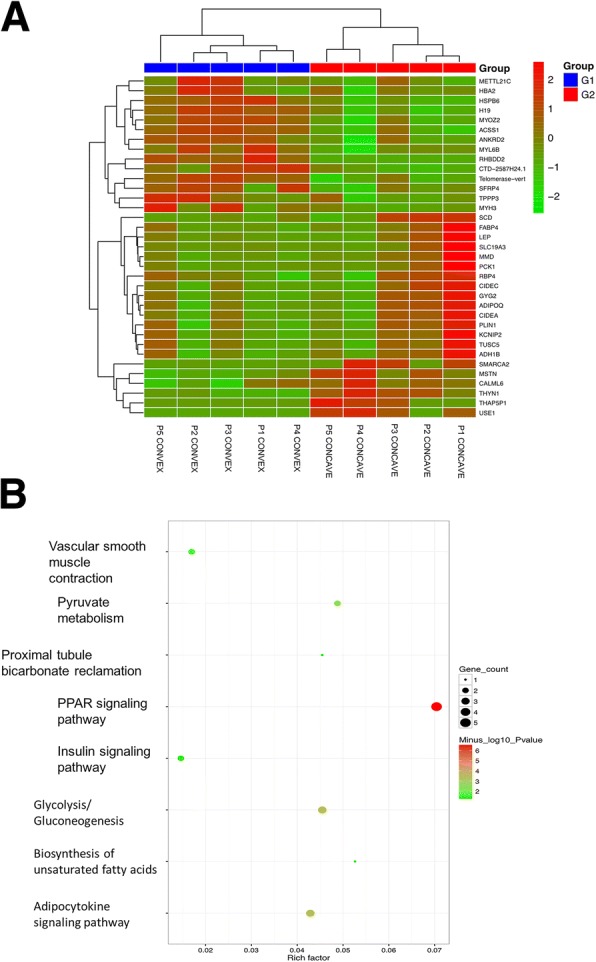
Fig. 1.

Differentially expressed genes in convex/concave paravertebral muscles in AIS. a Heat map and hierarchical tree comparing differences in gene expression in convex-sided (G1) and concave-sided (G2) paravertebral muscle of AIS patients (n = 5). Each line represents the changes (direction and intensity) in each transcript, and each column represents an individual sample according to group (P1CONCAVE represents the concave sided muscle sample of patient 1 and P1CONVEX represents the convex sided muscle sample of patient 1). The lines represent transcripts altering between two sides (p < 0.05 and fold change> 2). b KEGG enrichment analyses of differentially expressed genes (DEGs). The prominently over-represented pathways included those for PPAR signaling pathway and biosynthesis of unsaturated fatty acids
