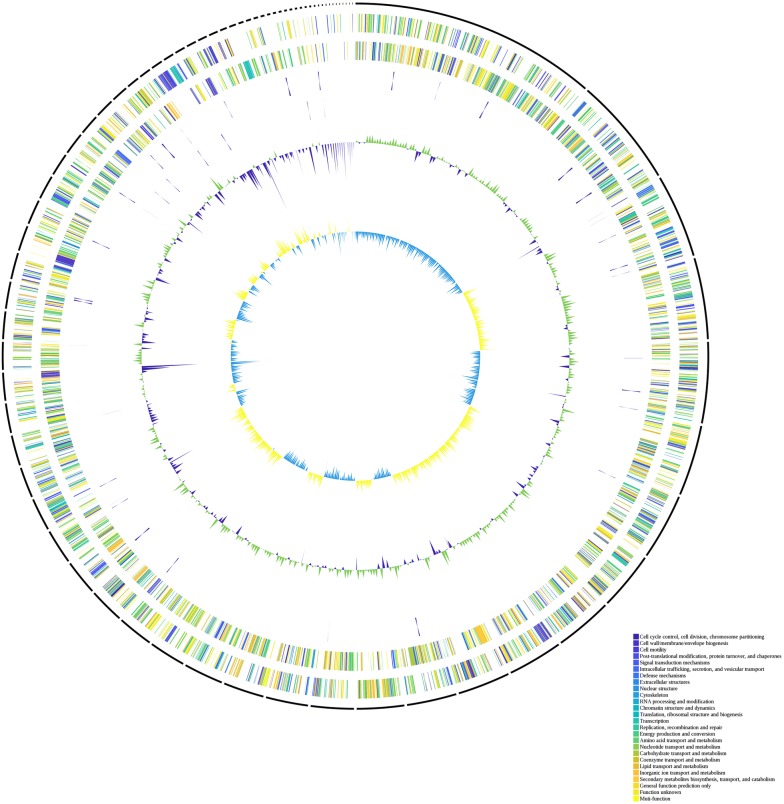
Fig. 1.
Circular genome map of S. algae ACCC. Circles from the outside to inside showing: (1) DNA coordinates; (2, 3) function-based color coded mapping of the CDSs predicted on the forward and reverse strands. Functions are color-code; (4) tRNA genes; (5) rRNA genes; (6) GC plot showing regions above the average (green) and below (violet); (7) GC skew showing regions above average (yellow) and below (light blue)

