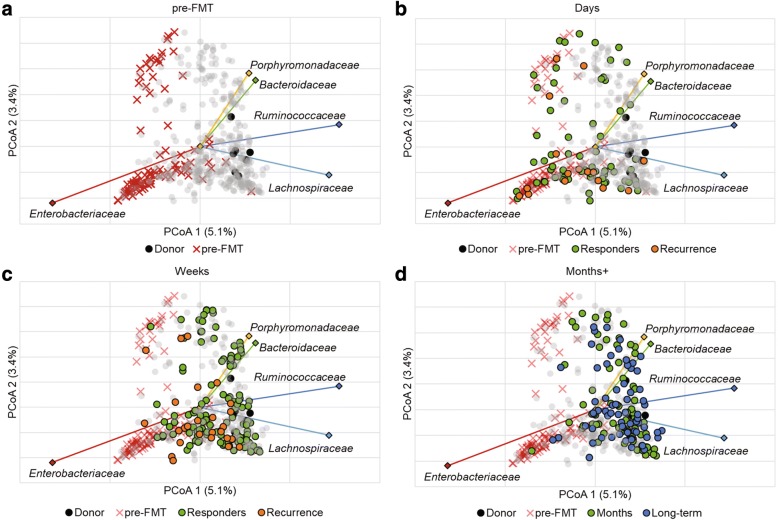
Fig. 3.
Ordination of Bray-Curtis dissimilarity matrices by PCoA (r2 = 0.23) and the five most abundant families. Panels reflect the same analysis but are colored by time point for clarity: a) pre-FMT, b) days (2–6 days post-FMT), c) weeks (7–20 days), and d) months (21–60 days) and long-term (> 60 days). A total of 471 axes were used to explain all variation with the remaining axes explain < 2.3% of the variation individually. Family abundances were significantly related to x-axis position by Spearman correlation (P < 0.05). Legend: black circle—donor, ex mark—pre-FMT, green circle—responder/months, orange circle—recurrence, blue circle—long-term, gray circle—sample not associated with time point

