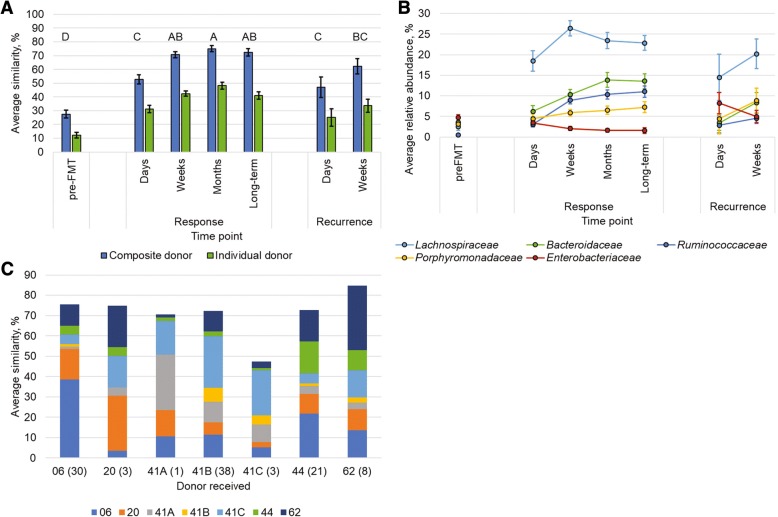
Fig. 4.
SourceTracker analysis of engraftment in patient samples. A) average engraftment in patient samples with analysis performed using all donors pooled (“composite”, blue) or only samples associated with a single donor lot (“individual”, green). Letters indicated significant differences by Tukey’s post hoc test (P < 0.05) for the composite analysis only, where sample groups sharing the same letter did not differ significantly. B) Classification and abundance of OTUs determined to engraft by SourceTracker in the composite analysis. C) Similarity of responder fecal communities to unique donor lots at the ‘weeks’ time point (separate analysis than that shown in A). Numbers in parentheses reflect the number of samples. Fecal material from donor 42 was not available for sequencing. In all panels, error bars reflect SEM

