
Figure 3.
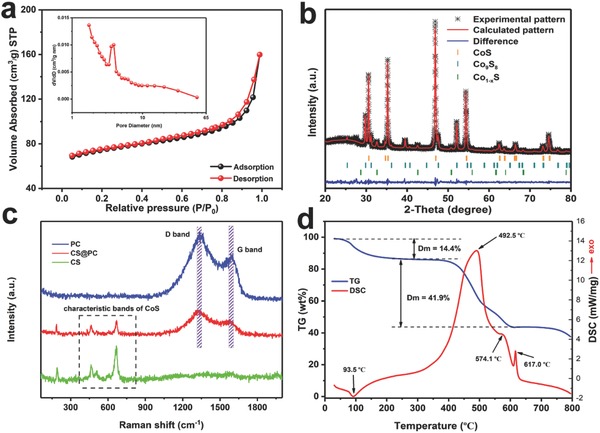
a) N2 adsorption–desorption isotherm and b) X‐ray diffraction pattern with Rietveld refinement of CS@PC. c) Raman scattering spectra of PC, CS, and CS@PC and d) TG‐DSC curve of CS@PC.
Official websites use .gov
A
.gov website belongs to an official
government organization in the United States.
Secure .gov websites use HTTPS
A lock (
) or https:// means you've safely
connected to the .gov website. Share sensitive
information only on official, secure websites.
a) N2 adsorption–desorption isotherm and b) X‐ray diffraction pattern with Rietveld refinement of CS@PC. c) Raman scattering spectra of PC, CS, and CS@PC and d) TG‐DSC curve of CS@PC.