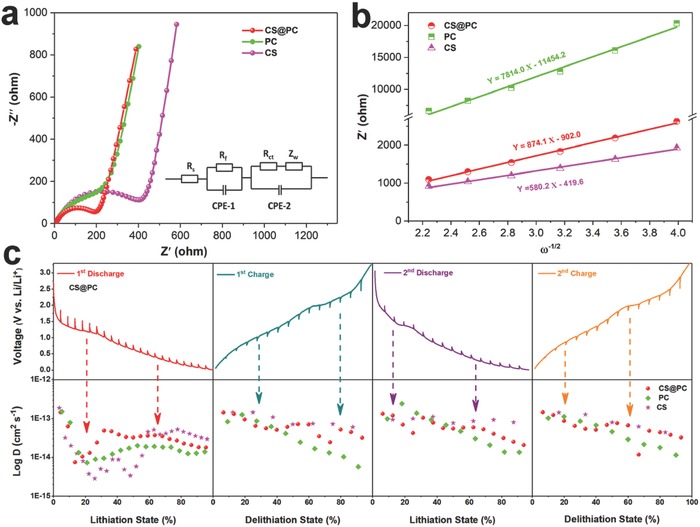
Figure 7.

a) EIS spectra of CS@PC, CS, and PC electrodes, and the corresponding equivalent circuit (inset of (a)). b) The relationship plot of Z′ versus ω−1/2 at low‐frequency region. c) GITT curves and corresponding Li+ diffusion coefficient at different discharge/charge states of the CS@PC electrode.
