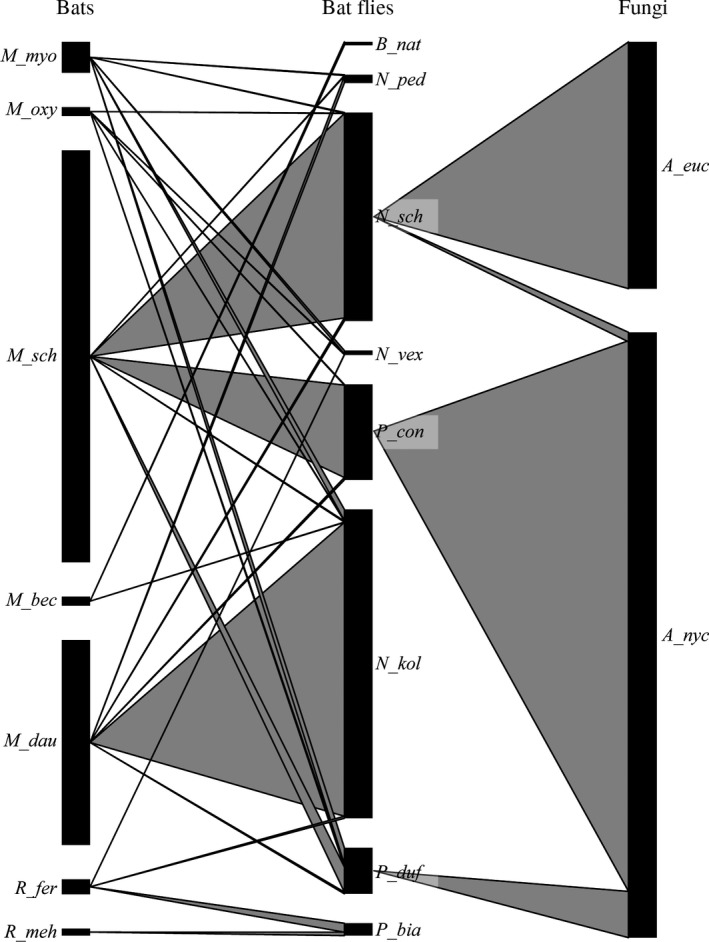
Figure 5.

Host–parasite–parasite network of the final temperate dataset. Shown is the association of bat flies with their bat hosts (left) as well as the association of Laboulbeniales (right) and their bat fly hosts. Bar width represents the relative abundance of a species within each network level
