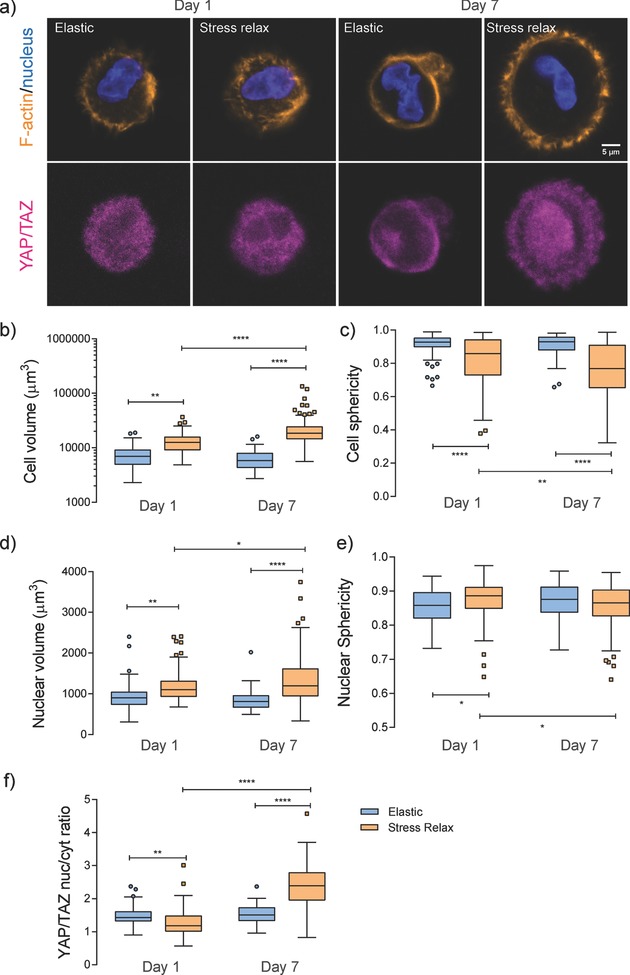
Figure 5.

Comparison of cell morphology and YAP/TAZ subcellular localization in elastic and stress‐relaxing gels. a) Representative immunofluorescence staining for F‐actin (orange), nucleus (blue), and YAP/TAZ (magenta) in hMSCs cultured in elastic and stress‐relaxing gels for 1 and 7 d. Images are shown as one cross‐sectional slice of a z‐stack with a step size of 1.5 µm. Scale bar = 5 µm. b–f) Quantification of cell volume, cell sphericity, nuclear volume, nuclear sphericity, and YAP/TAZ nuclear to cytosolic intensity ratio at the corresponding condition. Statistical analysis from one‐way ANOVA test, *, **, and **** indicating p < 0.05, 0.01, and 0.0001, respectively. Experiments were performed in three replicates per condition, and over 30 cells analyzed per replicate.
