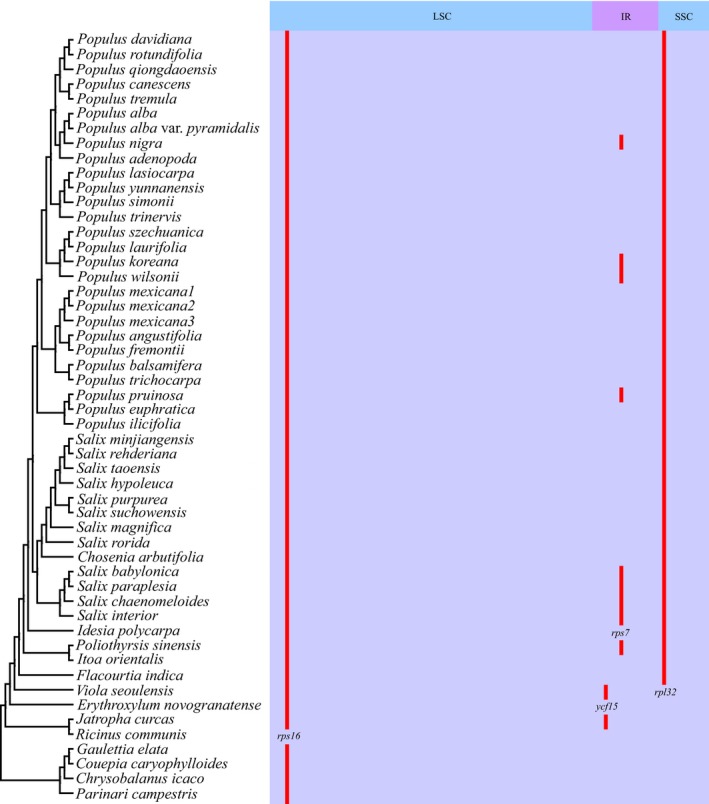
Figure 2.

Loss of chloroplast protein‐coding genes across Salicaceae s.l. and outgroups as indicated in Figure 1. Gray and red boxes indicate intact and possible pseudogenized genes, respectively. IR: inverted repeat; LSC: large single‐copy region; SSC: small single‐copy region
