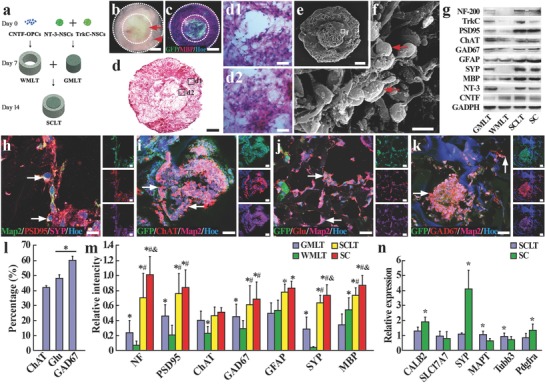
Figure 1.

Assembly of the SCLT and its phenotypic similarity to normal adult spinal cord. a) A schematic diagram of the assembling process of a SCLT. b) An overview of the SCLT showing good integration of the WMLT (arrowhead) and the GMLT (arrow) with no obvious gap. c) Distinct partition of the GMLT module (GFP positive) and the WMLT module (GFP negative, MPB positive) after being assembled into a SCLT for 7 days. d,d1,d2) H&E staining of a SCLT showing good cell distribution in both WMLT and GMLT region. e,f) Surface view of a SCLT as seen by scanning electron microscopy. g) After 14 days of culturing, protein expression of individually cultured GMLT or WMLT, SCLT, and normal spinal cord (SC). h) Cells (arrows) in the GMLT were triple‐stained for Map2, PSD95, and SYP. GFP and Map2 positive cells in the GMLT expressed i) ChAT, j) glutamate (Glu), or k) GAD67. l) Bar chart showing the percentage of ChAT, Glu, and GAD67 positive cells among all GFP positive cells. Asterisks indicate p < 0.05. m) Relative expression levels of different proteins in the GMLT, WMLT, SCLT, and SC groups, and asterisks, #, and & symbols indicate p < 0.05 when the SC group was compared with the GMLT, WMLT, or SCLT groups, respectively. n) Q‐PCR was used to detect the difference in expression of specific mRNA between the SCLT and normal spinal cord. Asterisks indicate p < 0.05 when the SC group was compared with the SCLT group. Scale bars = 500 µm in panels (b)–(d) and (e), 40 µm in panels (d1) and (d2), 5 µm in panel (f), 10 µm in panel (h), 50 µm in panels (i)–(k).
