Figure 3.

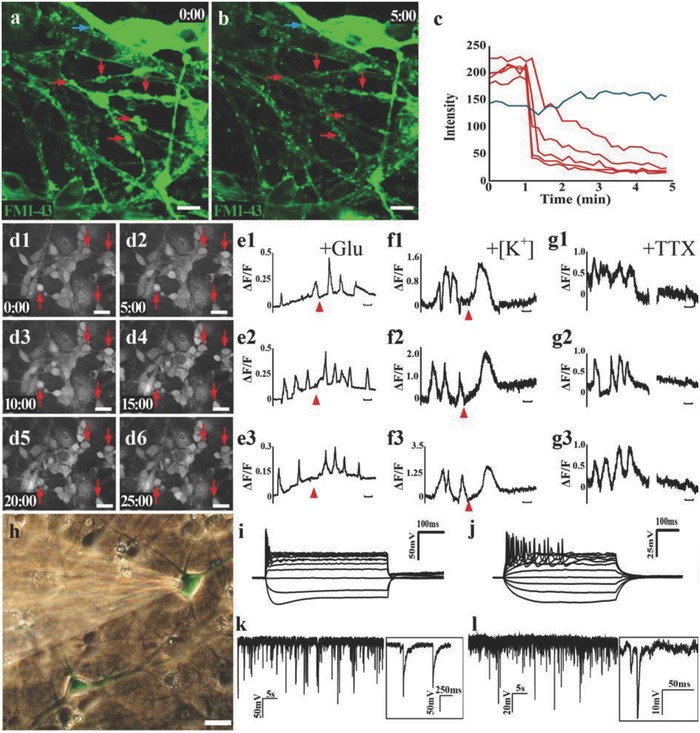
Functional assessment of the SCLT. a,b) Neurons in the GMLT were observed to unload prelabeled FM1‐43 dye (green) following membrane depolarization triggered by high [K+] stimulation, as shown by (c) the steep drops of fluorescence intensity after the stimulation. d1–d6) Neurons in the SCLT show spontaneous calcium surges (arrows) during Fluo‐4 calcium live cell imaging. Single‐cell tracing of calcium surges reveals that calcium activities in the neurons can be excited by (e1)–(e3) glutamate or (f1)–(f3) high [K+], and suppressed by (g1)–(g3) tetrodotoxin (TTX). h) Whole‐cell patch clamp recording exhibited the increased firing of action potentials of neurons from the culturing time (i) 7 days to (j) 14 days after the SCLT were assembled. k,l) High‐frequency miniature excitatory postsynaptic current (mEPSC in (k)) or miniature inhibitory postsynaptic current (mIPSC in (l)) were detected in neurons in the SCLT. Scale bars = 10 µm in panels (a), (b), and (d1)–(d6), 100 s in panels (e1)–(g3).
