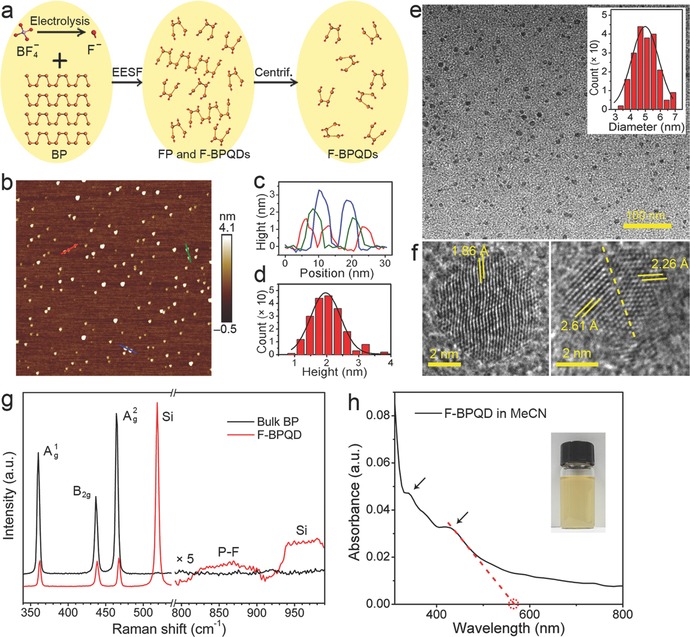
Figure 1.

Synthesis and characterizations of F‐BPQDs. a) Schematic of the synthesis of F‐BPQDs. b) AFM image of F‐BPQDs. c) Height profiles along the red, blue, and green lines in (b). d) Statistical histogram of the heights of F‐BPQDs measured from (b). e) TEM and f) HRTEM images of F‐BPQDs. The inset in (e) provides the diameter distribution histogram of the acquired F‐BPQDs. The dashed line in (f) indicates the lattice dislocation in the F‐BPQD. g) Raman spectra of F‐BPQDs and bulk BP. The spectra in the region of 800–990 cm−1 are multiplied by a scaling factor of 5. h) UV–vis–NIR absorption spectrum of F‐BPQD/MeCN dispersion. The arrows mark the absorption shoulders. The red dashed lines show a linear fit of the band edge of the first absorption peak. The inset is a photograph of the dispersion.
