
Figure 3.
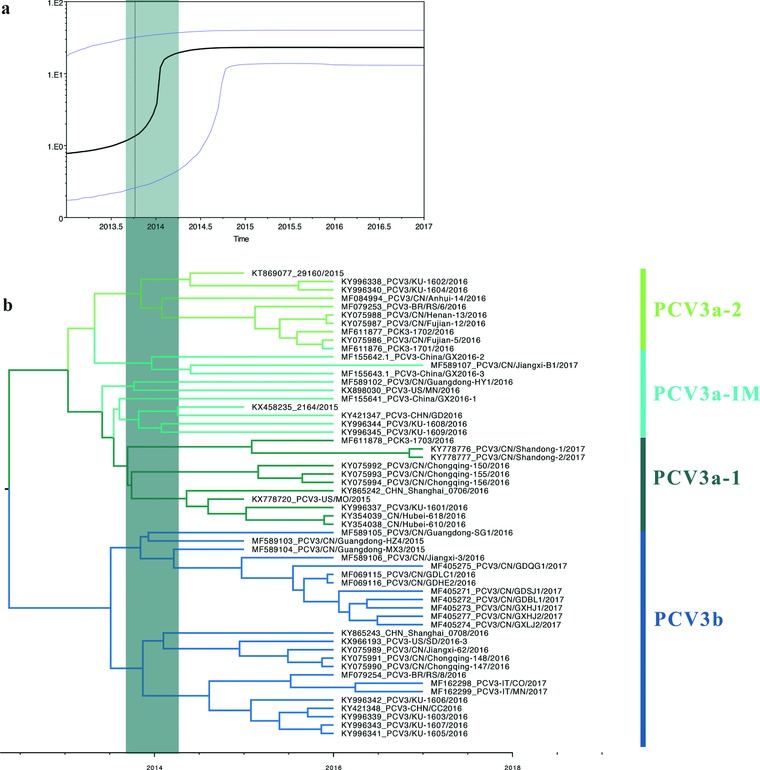
Bayesian skyline plot showing changes in genetic divergence of PCV3 complete coding sequences. a) A measure of genetic diversity is given on the y‐axis with the 95% HPD shown in blue. b) MCC tree scaled to time using the GTR+I+G substitution model and an uncorrected relaxed clock (lognormal) of PCV3 complete coding sequences. The green rectangles in both panels indicate the potential divergence period of PCV3 complete coding sequences.