
Figure 4.
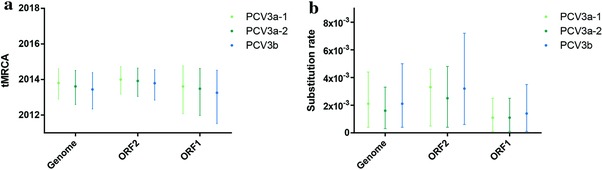
The tMRCAs and substitution rates were calculated in BEAST (v1.8.4) for ORF1, ORF2, and the complete coding sequences of PCV3a‐1, PCV3a‐2, PCV3‐IM, and PCV3b. The different genotypes are represented by different colors.
Official websites use .gov
A
.gov website belongs to an official
government organization in the United States.
Secure .gov websites use HTTPS
A lock (
) or https:// means you've safely
connected to the .gov website. Share sensitive
information only on official, secure websites.
The tMRCAs and substitution rates were calculated in BEAST (v1.8.4) for ORF1, ORF2, and the complete coding sequences of PCV3a‐1, PCV3a‐2, PCV3‐IM, and PCV3b. The different genotypes are represented by different colors.