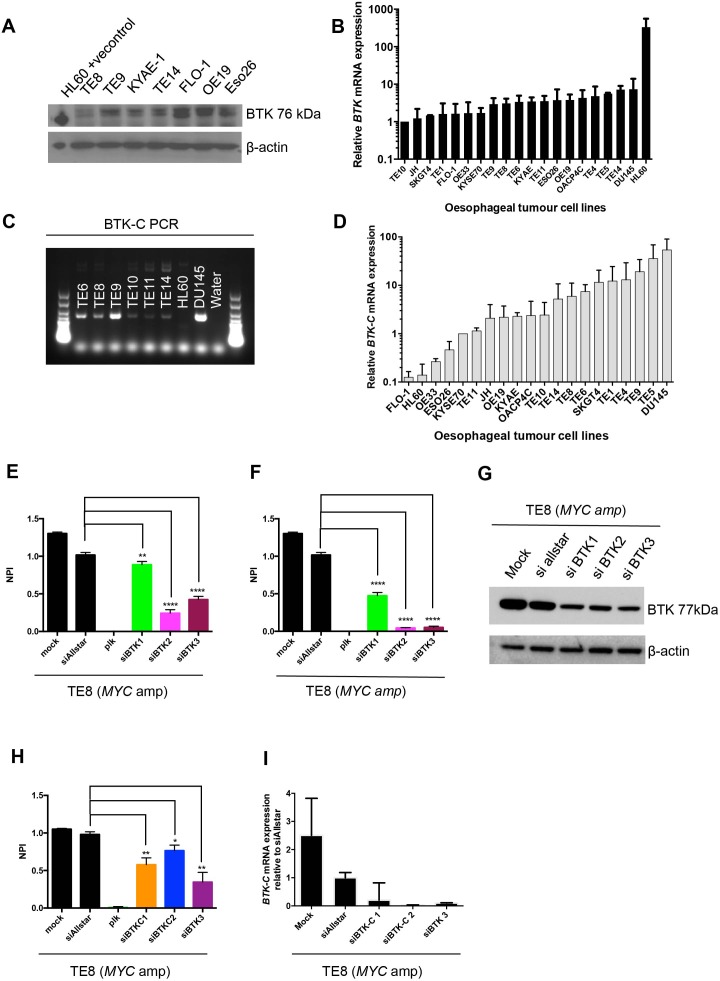
Figure 4.
BTK expression in oesophageal tumour cell lines. (A) Western blot showing expression of BTK across a panel of oesophageal cancer cell lines. (B) Graph illustrating BTK mRNA expression relative to TE10. (C) Agarose gel electrophoresis of BTK-C PCR products showing presence of the BTK-C splice variant in a panel of oesophageal cancer cell lines. (D) Graph illustrating BTK-C mRNA expression relative to KYSE70. (E) Bar chart showing decreased cell viability in parental TE8 after transfection with individual siBTK oligonucleotides compared with siAllstar. Normalised percentage inhibition = (negative control median − cell viability value) / (negative control median − positive control). (F) Bar chart showing decreased cell viability in TE8 with BTK overexpression after transfection with individual siBTK oligonucleotides compared with siAllstar. (G) Western blot showing decreased BTK protein expression following transfection with individual siBTK in TE8 with BTK overexpression (lentiviral transduction). (H) Bar chart showing decreased cell viability in TE8 after transfection with siBTK-C oligonucleotides. (I) Bar chart showing decreased BTK-C mRNA expression following transfection with siBTK-C oligonucleotides.

