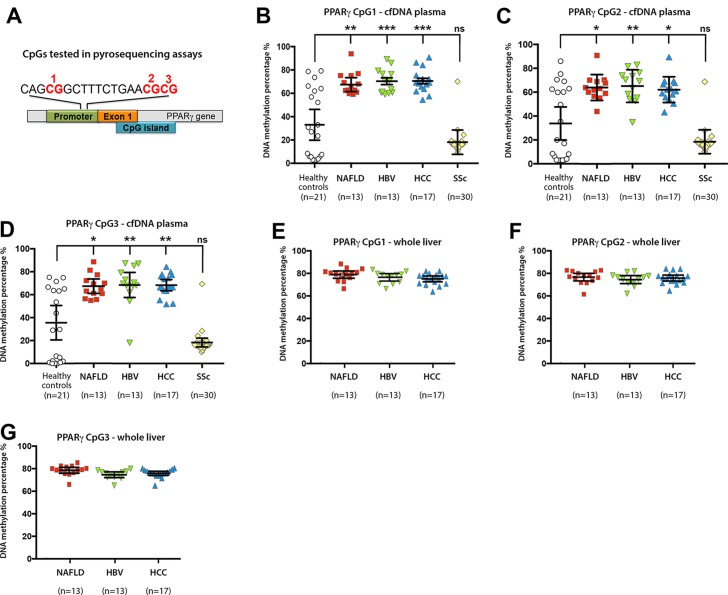
Figure 1.
(A) Schematic representation of human PPARγ gene promoter showing the positions of the differentially methylated CpGs 1, 2 and 3. (B–D) Plasma cell-free DNA methylation as determined by pyrosequencing at (B) CpG1, (C) CpG2 and (D) CpG3 within the human PPARγ gene promoter from control donors or patients with NAFLD, HBV, HCC or SSc. n, shows the number of individual patients within each cohort. DNA methylation was quantitatively measured and expressed as a percentage. Error bars represent mean values±95% CI; *P<0.05, **P<0.01, ***P<0.001. (E–G) Whole liver DNA methylation at (E) CpG1, (F) CpG2 and (G) CpG3 within the human PPARγ gene promoter in patients with NAFLD, HBV and HCC. All methods are listed in the online supplementary file. cfDNA, cell-free DNA; HCC, hepatocellular carcinoma; NAFLD, non-alcoholic fatty liver disease; SSc, systemic sclerosis.

