Figure 1.

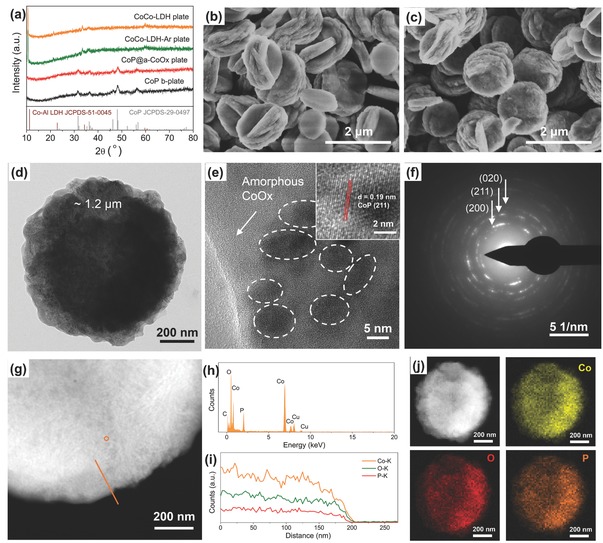
a) Powder XRD patterns of the CoCo‐LDH plate, the CoCo‐LDH‐Ar plate, the CoP@a‐CoOx plate, and the CoP b‐plate samples. b,c) SEM images of the CoCo‐LDH plate and the CoP@a‐CoOx plate, respectively, that contain ≈1.2 µm diameter round platelets. d) TEM image, e) HR‐TEM image, and f) SAED pattern of the CoP@a‐CoOx plate. g) HAADF‐STEM image of the CoP@a‐CoOx plate with an orange line showing the line scanning path, i) the corresponding line‐scanning profile, h) EDX spectrum of the CoP@a‐CoOx plate measured at position P in (g). j) HAADF‐STEM image of the CoP@a‐CoOx plate and the corresponding element mapping images displaying the uniform spatial distribution of Co (yellow), O (red), and P (orange).
