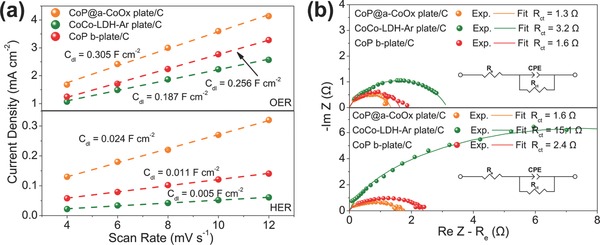
Figure 4.

a) Linear fitting of the capacitive currents versus CV scan rates for the CoP@a‐CoOx plate, the CoCo‐LDH‐Ar plate, and the CoP b‐plate samples for OER and HER, and b) Nyquist plots of the CoP@a‐CoOx plate, the CoCo‐LDH‐Ar plate, and the CoP b‐plate catalysts with conductive carbon obtained from EIS measurements at OER potential of 0.6 V versus Ag|AgCl (3.5 m KCl) (above) and HER potential of −1.3 V versus Ag|AgCl (3.5 m KCl) (below).
