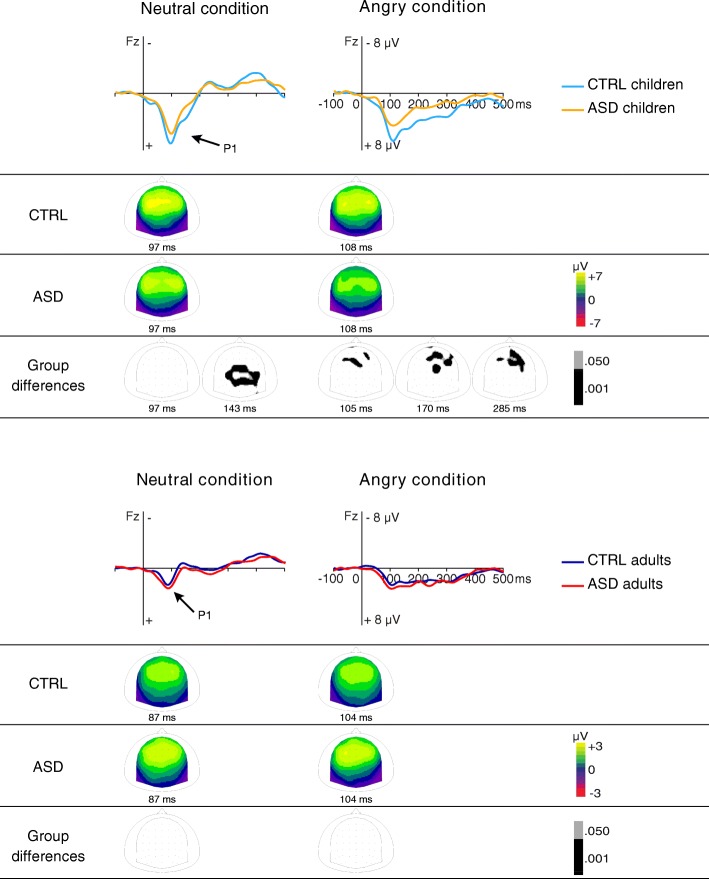
Fig. 2.
Grand average auditory brain responses to neutral (equiNeutral2) and angry (equiAngry) stimuli. Scalp distribution of the P1 response is displayed for each group along with group difference scalp distributions obtained with randomizations performed on the 50–500-ms time window (Guthrie-Buchwald time correction). Amplitude differences were observed between children groups for equiNeutral2 (123–181 ms) and for equiAngry (92–127 ms, 152–193 ms, 255–322 ms) while no differences were seen between adult groups

