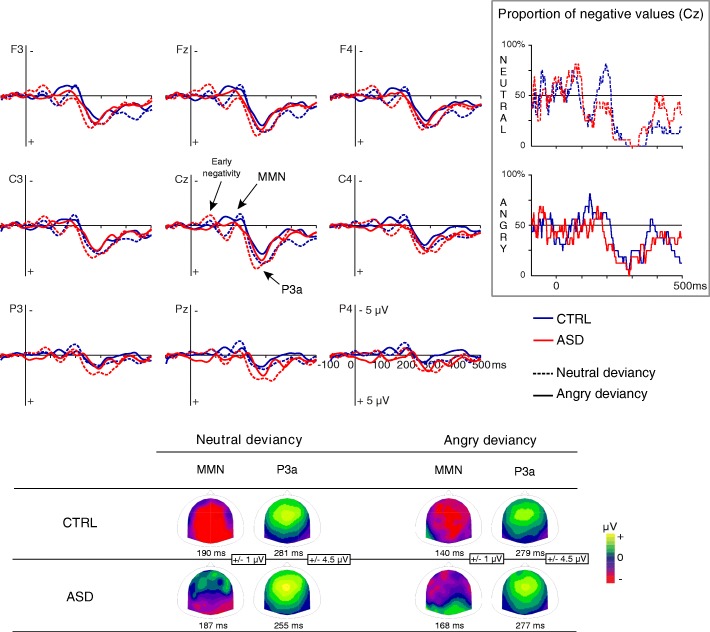
Fig. 3.
Brain responses to neutral and angry prosodic deviancies in CTRL adults and ASD. ERP of CTRL and ASD are displayed in blue and red line, respectively. Scalp distributions of MMN and P3a are displayed at the bottom of the figure. In the upper right corner, the proportion (%) of participants displaying a negative response at Cz is represented at each time point for neutral and angry deviancies in CTRL and ASD

